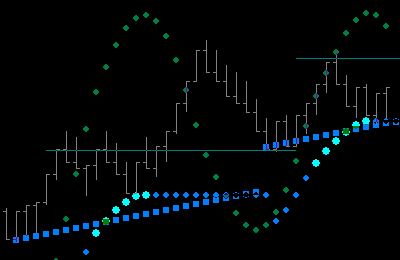
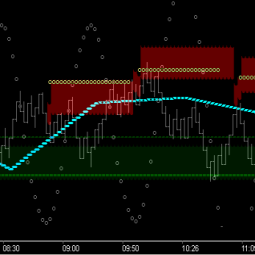
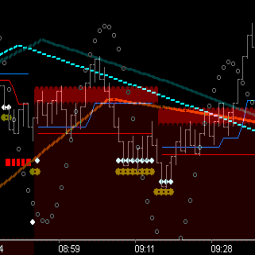
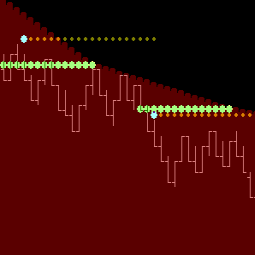
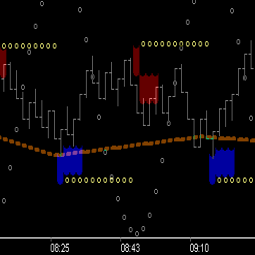
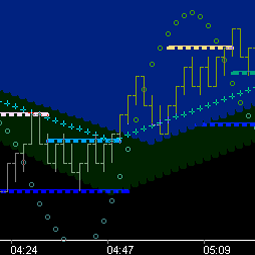
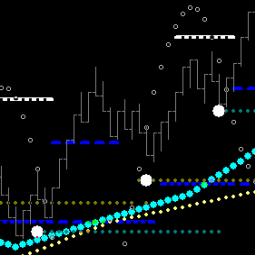
Revealed thus far . . . momentum up or down is slowed by price penetrating the wave leg. This is significant event #1 . . . ‘momentum slowing‘. When this occurs a ‘Friction’ vector is generated whose run-rate (Price/Time) is a derivative of momentum going into this friction point.
Momentum slowing enough to turn the wave is significant event #2 . . . ‘momentum turning‘. When this occurs the ‘Friction’ vector (fVector) generated when momentum slowed is revealed. The fVector from Trough has upward or [+] slope bias (ie support), and the fVector from Crest has downward or [-] slope bias (ie resistance).
Note: as discussed in the ‘Phi’ topic, the wave turn generally occurs at the 5 count from friction slowing.
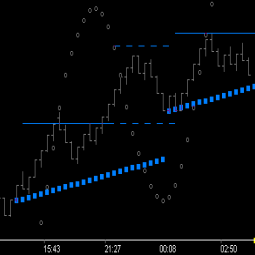
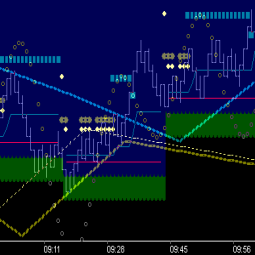
Below is shown the trough friction vectors of 2 consecutive cycles.
 It can be seen that price found support from these fVectors.
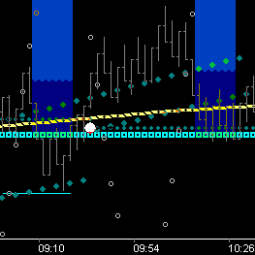
A student of vibration might wonder . . . ‘if the run-rate of the fVector has merit, shouldn’t it have a ‘square’ (ie significant) relationship with 45 units (or degrees) of time’?
or 90 units/degrees of time?
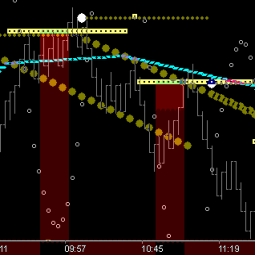
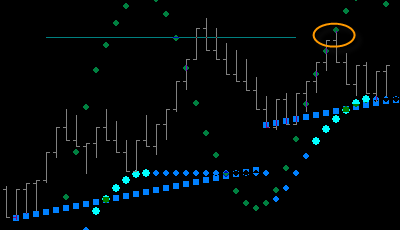 . . . so the 2nd top (circled) was looking ahead or ‘reacting to’ 90 degrees from the 1st fVector and 45 degrees from the 2nd fVector . . . a confluence of 2 corners . . . interesting.
But is that ‘perfect picture’ above all you need to trade successfully, consistently, in real-time, day after day?
To this point . . . the answer is no. [. . . Next]

