I have been studying ‘Gnomonic Growth’ for almost as long as I have been trading. It would probably be true that the mathematical allure of this phenomena was the initial force garnering my attention, taunting my faculties, relentlessly teasing my puzzle solving ilk. This mesmerizing secret of nature, this beautiful secret of all things, turning me into a student of Vibration, a student of Phi, a student of gNomonics.
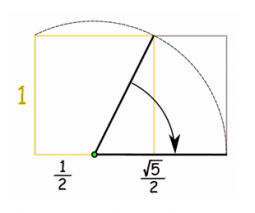
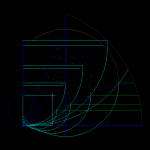
Greek mathematicians called growth by accretion or accumulative increase ‘gNomonic expansion’. The key concept here being ‘accumulative increase’ . . . ie, an additive process. Many have missed this key when trying to apply expansion formulas to market vibration. This type of growth is the way the Golden Mean Rectangle expands, producing the Golden Mean Spiral flowing through its many intersections.
All forms of life, which grow by ‘gNomonic expansion’, expand at a repetitive mathematical increase of the prior growth range.
There is a great deal of information available regarding gNomonic expansion. The construction of: (math), beauty of: (nature), use of: (Architecture), history of: (sacred science) . . . all of which lead to understanding of the ever present character (ubiquitous nature) of gNomonic principles and proportions.
What you won’t find much written about is application in ‘Cycle Theory’. And specifically. . . how one can apply this ‘Natural Law’ phenomena to vibration in the markets.
All market Vibrational Cycles have these traits or principles in common:
- Cycle Origin (which is also End of prior cycle, ie 360* is end of cycle and at the same time new beginning 0*)
- 360* of Time moving forward
- 720* of Price expansion potential (360* Above and 360* Below)
- Price ‘Above’ space manifests as 4 levels of gNomonic expansion potential (0-360*)
- Price ‘Below’ space manifests as 4 levels of gNomonic expansion potential (0-360*)
- All manner of mathematical framework in both Time and Price; ie midpoint of cycle time, price above origin in some stage of expansion, price below origin in some stage of expansion, etc.
- The 3rd gNomonic Expansion level (270*) is both a significant ‘target’ level and a significant ‘resting’ level (as is revealed in the study of Natural Law and the Square of 9).
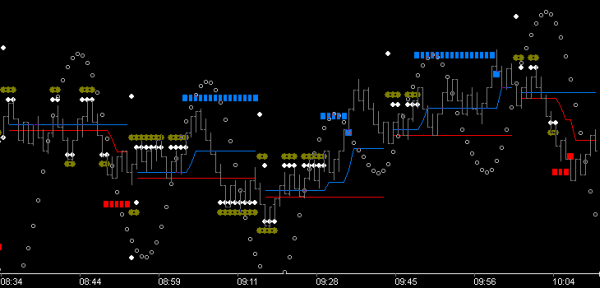
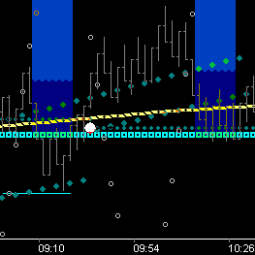
Cycle duration of 26 works well as an example (since wave length of the Momentum Wave is 26)
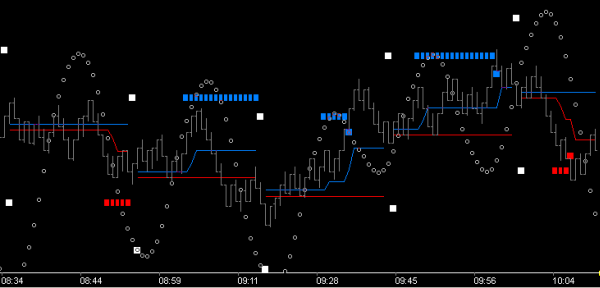
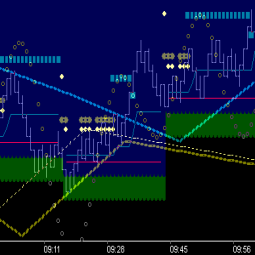
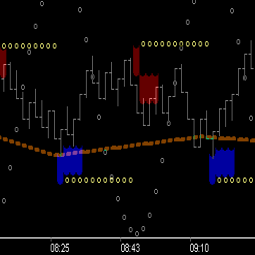
Studying from left to right in the above we can glean the following:
- 8:34 > price vibrating on either side of the Above/Below space
- 8:44 > price move in [-]space exceeds 180* expansion level, triggering 270* expansion target (red)
- < 8:59 price steps into new cycle and maintains support in [+]space
- 8:59 > price rises above 180* expansion level, triggering 270* target (blue)
- < 9:11 price retraces from trigger level (typical) and falls to complete prior cycles (red) target.
- < 9:28 price finds support at target completion level, enters new cycle and rises into [+] space. (Note: price level of prior cycle’s upside target is known)
- 9:28 > price rises above 180* expansion level, triggering 270* target (blue). (Note: overshoot of target completes the prior cycle’s target . . . and price rests into next cycle origin)
- 9:45 > price steps into new cycle and maintains support in [+]space
- 9:56 > price rises above 180* expansion level, triggering 270* target (blue), proceeds directly to target, and rests.
- < 10:04 price drops into [-]space, exceeds 180* expansion level, triggering 270* target (red), proceeds directly to target, and rests.
The above pic and discussion demonstrates the core principles of cyclic gNomonic expansion as described . . . and as they play out in market vibration every day.
Missing from this example is the Trigger/ Bumper Mechanism of the cycle.
From reading thus far . . . we will assume you understand the significance of midpoint . . . and midpoint of anything is 180* of the whole. A significant marker point indeed . . . and it is even more significant when the structure is non-linear, as is the case with gNomonic expansion. The significance (or strength of midpoint) is compounded with the introduction of both the energy and time it takes to achieve a non-linear midpoint. Suffice it to say: the non-linear aspect of the 2nd gNomonic expansion level (or 180*) is an incredibly strong holding point of price. Out of this understanding was born the term Bumper . . . specifically the 108* Bumper . . . because of the correlation with the 108* time point of the Sqr9.
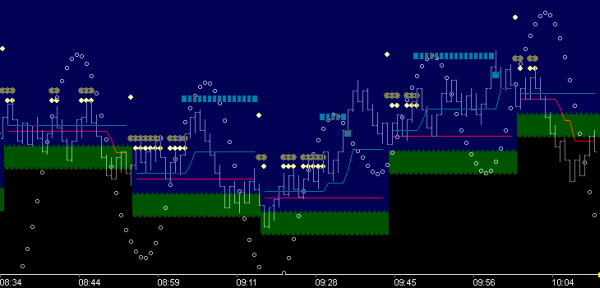
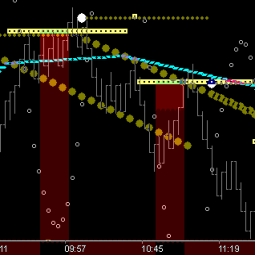
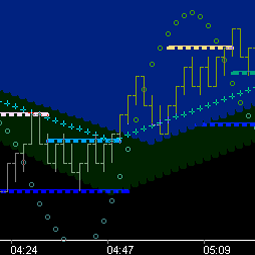
Let’s review the previous chart, adding the bumpers, and focus on just the ‘Above’ gNomonic perspective.
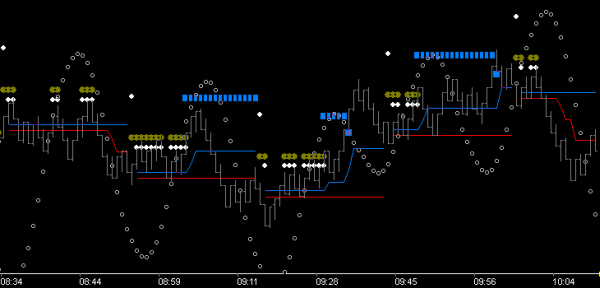
Now we can see the bumpers in each cycle and recognize the holding/resistance force they embody. White dots are the 180* level and the brown dots are the trigger level for targeting the 270* expansion level. Make note that it is most typical for price to diverge from completion of the 270* target. There are many reasons for this which we will discuss, but at this point make it your understanding that price typically retraces from trigger point because it has run into the ’21’ price level . . . the 45.
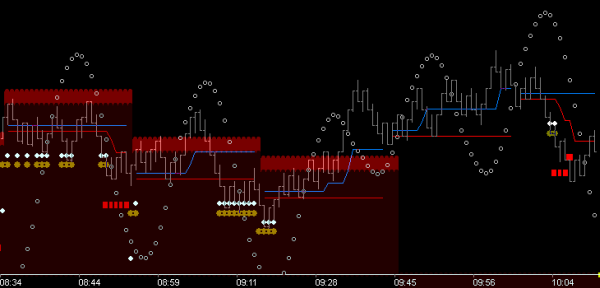
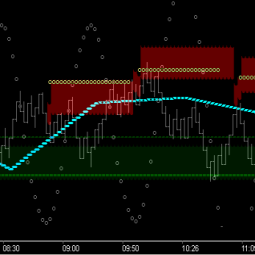
. . . adding the ‘Below’ gNomonic side (w/bumpers) . . . we can see many significant events:
- 8:34 > price is bracketed by bumpers on both sides
- < 8:59 price w/below target is held by above bumpers
- < 9:11 price completes below target and is held by bumpers
- > 9:11 price steps into new cycle, drop is held by bumpers (absolute best entry for above target, min risk, max reward)
- > 9:28 price triggering 2nd above target should invoke momentum to completion levels
so . . . Price typically retraces from 270* target trigger point . . . understanding that is key to successful gNomonic target trading . . . and there are many levels of support/resistance (ie thresholds) that price can retrace into. As demonstrated above, the extreme threshold is found at the bumper level of the opposing force. Think about that. Price triggers further upside at the 180* ‘above’ expansion level of a cycle . . . then moves all the way to the 180* ‘below’ expansion level of the cycle, or the next cycle. That is Natural Law at work. Knowledge of that . . . and internalization of that . . . invokes patience in you . . . patience to trade at max reward/min risk levels or the opposing force.
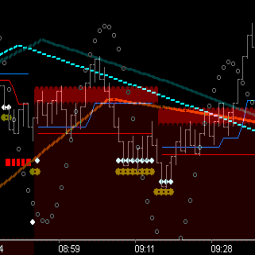
Long term success can be realized by constructing charts which show this clearly . . . Why? . . . because visualization of this framework of ‘gNomonics Expansion‘ structure is a missing component for most traders.
Important . . . the above charts also reveal that it is extremely beneficial to view the opposing forces of market vibration independently . . . and then trade the side (the force) which has rulership.
The subject of ‘Rulership’ brings us full circle back to directional bias . . . and hopefully it is obvious that missing in the above examples is the visualization of the framework of ‘Time’ structure, as discussed in the previous three chapters; Vectors, Time Fences and Directional Bias . . . review as necessary . . . and understand . . .
Without time, it is very difficult to trade anything, including the above, successfully . . . consistently. Why? . . . because time invokes momentum, and we want to trade with momentum. Time invokes patience. Patience for what? . . . patience for momentum in the correct direction of the trade. Time invokes Proof-Point logic. It’s not enough to know the target is likely to complete . . . price needs to be on the right side of the Proof-Point, and the Proof-Point is Time. [. . . Next]

